Tillering rate is a useful statistic in plant phenotyping: over its growing life (perhaps 12- 16 weeks), depending on treatment and environment, a plant might develop up to 20 tillers; the final total and its rate of development represent important plant characteristics. Traditionally these are determined by manual measurement, often as part of partial destructive harvest. It is unlikely that plants will be measured every day, and when measurements are made there is a reasonable possibility of them being in error by one or more tillers as the structure of plant often makes precise counting very difficult.
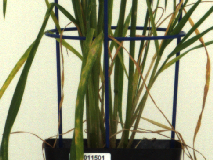
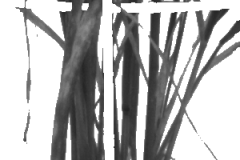
Thus good quality measurements of this statistic are not easy to obtain, especially in quantity. In this work an approximate solution to this problem is presented by automatically studying large numbers of 2D images taken of plants over an eight week growing interval. Analysing windows of these images and identifying tiller-like structures provides a 12-dimensional feature describing the image. Limited ground truth then permits a regression estimate from this feature to give the number of tillers evident. The estimate can be improved by combining (cheaply obtained) multiple views, after which the time series of noisy estimates may be further improved by dynamic programming to determine the most likely development over the interval.
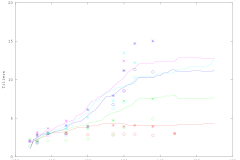
Results suggest a RMSQE of approximately one tiller. When replicates are averaged, behaviours of 5 different treatments become clear; these automatically obtained estimates are confirmed by manual ground truthing.
The approach developed lends itself to reuse for any similar imaging setup, and any plant with tillering characteristics similar to wheat.


